The Price-to-Earnings (PE) ratio is a widely used tool by investors to evaluate a company's stock, but it is often used incorrectly. Many investors use PE ratio as a single indicator to determine a company's value, without considering other important factors such as financial performance, growth prospects, and industry trends. This leads to incorrect valuation conclusions and misinformed investment decisions. In this article, we will deep dive into the PE ratio to understand its true significance and the correct way to use it in stock evaluation. We will also look at some of the common mistakes investors make with PE in their decision making process and how to avoid them.
Let's start with understanding where PE comes from through a small QnA session?
What is a stock?
Stock represents the share of profit of a company. When you buy a stock, you basically are buying share in company's profit or earning.
How do you ascertain the value (price) of the stock you are going to buy?
Fundamentally speaking, you are buying something and you pay a price for that. But how do you know you are paying the correct price. For this case, the value or price will be derived from the earning. Why? Because stock basically means part of the earning.
Now how do you put a price on this earning (i.e. the share price you pay)?
Let's call this company ABC and let's say we put an arbitrary price of Rs.100 for its share having earning (net profit) of Rs. 1 per year based on some assumptions.
Now think there is another company MNQ with similar size to ABC and offering similar product, however having higher reported earnings as compared to ABC i.e Rs. 2 per share. Let's say you got interested in buying stock of MNQ.
How much you will pay for MNQ's stock. Your options are:
a. You will pay Rs. 100
b. You will pay more than Rs. 100
c. You will pay less than Rs. 100
The core question you have to answer is:
Is MNQ more valuable than ABC or less which in turn mean should you pay more or less for it than ABC?
Having no other info about ABC and MNQ, the most logical way to reach conclusion here is to reverse engineer what we are paying for i.e. we are paying for share of profit or earnings. So all else equal, the stock which offers higher earning should be assigned higher relative value.
Hence in this particular case, you will be willing to pay more than 100 for MNQ as its earnings (Rs. 2) is more as compared to ABC (Rs. 1). Mathematically speaking we solved the following equation:
If 100 is the price we pay for earning of ABC which is Rs. 1, what should we pay for the earning of MNQ which is Rs. 2
I am sure you all have solved such questions in your school days. Let me remind you of the famous Yadi questions. If you are old enough, these were the gold standard and a weapon used by elders to test our wits.
I already see you smiling :-). Sorry for digressing. Let's get back.
In summary, from the QnA above, we can infer that:
As an investor, with no other info than earnings, we will assign and pay higher value (share price) for a company with higher earning as compared to the one with lower earnings.
So next time when you buy a stock, just do this simple calculation in your head to get a hang of what kind of price you are paying for the stock. The calculation you have to do is the following:
Take the price of the stock you are about to buy. Divide it by its earning per share of last 4 quarters. Call it P1. Do the same calculation for a stock from same industry and of comparable size you may already hold. Call it P2. Now to ascertain if you are paying a reasonable price for the stock, just compare the two values. Here is how to draw very quick and dirty inference from your calculated data:
a. if P1 is significantly higher than P2, you might be paying too much for your new purchase.
b. if P1 is significantly lower than P2, you might be getting a great bargain.
c. if P1 is more or less equal to P2, you might be paying a reasonable price for the new stock.
You can get the EPS data for your calculation from financial results of the company. However, you can get it painlessly
here on our PE Dashboard.
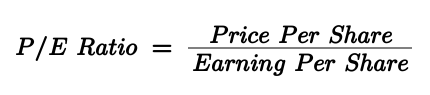
If you are still with me, then allow me to introduce you to PE ratio. What you basically did just now is calculated and compared the P/E ratio of the stock you are going to purchase with the PE ratio of stock of comparable size you already hold from same sector. To reiterate, the outcome of the comparison is a rough idea on if you are paying a reasonable price for your new stock or not. Visually, this is the formula you used to calculate PE for comparison.
Having understood valuation (relative valuation to be more accurate) from the first principle, now is the right time to tell you why I took you through this breaking into basics path. The whole idea of this discussion was to tell you that PE is not a fundamental characteristic of a stock. It's a derived value from earnings (which is actually a fundamental characteristic of a stock).
A quick note on what fundamental characteristic mean, so that we are on the same page. Fundamental characteristics of a company include things like revenue, earnings, assets, market share, and management quality. These are intrinsic or inherent to the company and are not directly affected by market conditions or investor sentiment.
So PE ratio does not exist until you calculate it. And if you calculate it to save your effort and time and draw you valuation conclusions solely based on PE, then you are doing it wrong. How? Hear this:
P/E ratios are not the reason of excellent earnings, but an after effect of variability in earnings.
Just to disillusion you, P/E ratios, on their own, don't tell us whether one company is cheaper than the other. Look at the current PE of following 10 companies. Can you tell which one is overvalued and which one is not?
I hope you got what I mean here. You need context to reach any reliable conclusion on valuation. Where the context comes from? Context comes from:
1. PE comparison with Peer
2. PE comparison of a firm with its own PE history
3. Looking at growth prospects of the company
4. Looking at dividend history
5. Looking at current market phase (Bull market or Bear market)
6. Looking at interest rate
7. And most importantly, looking at Return on Equity (RoE) and Return on Invested Capital (RoIC)
Long list? Don't worry, we will cover them one by one in more detail while we reassess the most common belief about PE ratio i.e. High PE means overvaluation and Low PE is often indicator of undervaluation.
This is a very common belief. You may find investors who have rules like the following:
if (PE > 50)
{
Forget investing, I will not even look at the stock;
}
or
if (PE < 12)
{
I will sell my house and buy this;
}
If you too belong to the same school of thought, who bases his decision solely on PE without any contextual digging on why the PE is so high or so low, you need to take a pause and seek few key answers first.
Questions on sectoral PE analysis to check if stocks PE is above Industry average or not
1. What is the sector or industry the particular stock belongs to?
2. What is the average PE of the industry?
3. Is the PE of the target stock is less than industry average or greater than industry average?
Questions on own Historical PE analysis to check if current PE is at historical high or low or somewhere in between
1. What is the historical High for PE of target stock?
2. What is the historical Low for PE of target stock?
3. Where the current PE stands in the range?
Questions on EPS growth analysis to justify high valuation
1. What is the EPS growth rate of target stock?
2. Is it more that industry peers? If yes, then high PE as compared to industry peers may be justified.
3. Is it on the lower side as compared to industry peers? If yes, then lower PE as compared to industry peers may be justified.
Overlay EPS growth rate analysis on top of historical PE analysis. If there is increase in EPS growth rate recently then current PE near historical high may be justified and vice versa.
Just to give you a perspective on the role of EPS growth rate, here is what happens to a currently 50 PE company (very expensive) in 5 years. If it's EPS continues to grow at 20% for 5 years, at the end of 5 years, it will turn to a 20 PE company. Not convinced? Let me show you the math:
Lets take example of a company
whose Current EPS = 1
and Current Price = 50
and has EPS Growth Rate = 20%
So its Current PE = Price/EPS = 50/1 = 50
@ 20% CAGR, EPS after 5 Years = 1*(1+20/100)^5 = 2.5
Let's assume there is no change in stock price as it was very expensive at the beginning - although, its highly unlikely for a stock whose earnings are growing @ 20%, but let's assume :-).
Stock Price after 5 Years = 50
So PE at the end of 5 Years = 50/2.5 = 20
Hope you are convinced now. If you want to have more fun, just vary the EPS growth rate and see what kind of effect it has on PE in long term. You will be convinced that:
EPS growth rate is the primary reason for some stocks to always look expensive, yet be a multibagger.
Let's go further down the rabbit hole overlaying Dividend history analysis on top of this. If dividend is growing without growth in EPS a lower PE may be justified and vice versa.
Additionally, if the market is in roaring Bull phase along with lower interest rate regime (loans available at cheaper interest rate), then PE will generally be inflated across the board. It's known as Euphoria.
Now just to clarify, all these cause and effects don't have linear relationship. Most of the time the relationship is non linear so the effects reflected on PE may be bit inflated or depressed on case to case basis. However, I am sure you got what we are looking for i.e. justification for why PE of target stock is like what it is (either high or low or average).
But that's not all. Let me tell you about the two key financial metric that are strongly correlated and contribute more directly to PE (yet less attributed for their role in affecting the PEs). They are RoE and RoIC.
RoE and RoIC analysis to justify valuation
Return on Equity (RoE) is a financial ratio that measures the profitability of a company in relation to the equity of its shareholders. It is calculated by dividing the net income of a company by its shareholder equity. The higher the RoE, the more profitable the company is considered to be.
Imagine 2 companies having same net income or profit. However, one is having smaller shareholder equity (you being a shareholder will be part of shareholder equity). Hence more RoE than the other even though both earned same profit. Which one you will pay more for? Obviously for the one which has higher RoE for same net profit. By this logic, should it not trade at higher PE as compared to other. You will surely miss this RoE angle if you do a plain vanilla PE calculation. You will wrongly tag the stock with higher PE overvalued, which it is not if you consider the extra couple of points added to PE can be attributed to higher RoE in this case.
Similarly, RoIC also offers more reliable justification on valuation. Return on Invested Capital (RoIC) is a financial ratio that measures the profitability of a company in relation to the capital invested in it. It is calculated by dividing the company's operating income by its invested capital (the sum of its debt and equity). The higher the RoIC, the more efficient the company is in generating returns on the capital invested. Which company you will pay more for. The one which is more capital efficient even though they report same net profit. Right? Again, you can not understand the additional push to PE valuation, if you fail to look at capital allocation efficiency angle. As the case with RoE, this insight is simply missing in plain vanilla PE ratio calculation formula. Hope you agree now:
The stock with higher ROE and RoIC will command higher PE as compared to a peer who has same net profit.
So next time if you get confused on justifying some high PEs among peers, do check for RoE and RoIC. Hopefully your justification problem will get resolved without putting in extra effort.
Remember, stock market has a collective brain, which is fed by the collective intelligence of all the participants. This collective brain is able to process and analyze a vast amount of information, which allows it to make more informed decisions when valuing stocks. This is why the stock market, as a whole, is often able to correctly value stocks more accurately than individual investors can on their own. We just went through a live example. Most probably you were using PE without context and getting confused why some stocks or industries historically command high PEs. But collective intelligence knows better as there are participants out there who are putting in extra effort to contextualize the valuation metric.
After this refresher on PE basics and contextual analysis, you are well positioned to avoid some common mistakes investors make while using PE in their decision making. These mistakes are direct consequence of some missed contexts discussed above. Here are some common and some more nuanced PE mistakes and the steps to avoid them:
Mistake 1: To blindly believe stock is undervalued if it has a low P/E and overvalued when has high PE
It is one of the most common myth that a stock is cheap if it has a low P/E ratio and expensive if it has high P/E ratio. Generally, it is recommended to stay away from high P/E stocks, but this notion is incorrect. Why? We have already discussed this in great detail above, so will straight away jump to step to avoid this mistake.
1. Make peace with the following statement.
It's normal for stocks to have PE in different ranges. Some may be absurdly high or low.
2. As a first level check, use P/E ratios just to determine whether the stock prices makes sense or not.
3. If it does not make sense in first pass, go for the contextual analysis above to reach final conclusion.
Mistake 2: Compare P/Es of two dissimilar companies
Another common mistake is to compare PEs of two dissimilar companies. Remember, PE that is considered very high for a industry can be considered very low for other. However this is not all. If you are not attentive enough, comparing PE ratios within the same industry is also error prone. Widely moated businesses that are more efficient in terms of capital expenditure, working capital and asset turnover ultimately have higher RoEs and RoIC. Therefore they may warrant higher PEs within same industry. To cut long story short, the interpretation of P/E ratio is highly dependent on how successfully you pin point the worthy peers for comparison.
To avoid this mistake, follow these steps:
-
-
Identify the industry: Group stocks into the same industry based on their products, services, and customers.
-
Find comparable companies: Look for companies within the same industry that are similar in size, business model, and financial performance.
-
Analyze industry trends: Study the overall growth and performance of the industry to understand the broader context.
-
Consider company-specific factors: Evaluate the company's financial performance, competitive advantages, and growth potential.
Once you have got a very small set of appropriate peers, you can start your work on relative valuation exercise.
Mistake 3: Not analyzing the historical PE of the company
There are several reasons why it can be beneficial to consider historical PE data when analyzing a company's current valuation:
-
-
Valuation trends: Analyzing historical PE data can help investors identify trends in the company's valuation over time. If a company's PE ratio has consistently been above or below the industry average, this could indicate that the market has a positive or negative view of the company's growth prospects.
-
Comparisons: Historical PE data can also be used to compare a company's valuation to that of its peers or the industry as a whole. This can help investors identify whether a company is undervalued or overvalued relative to its peers.
-
Context: Historical PE data can also provide context for a company's current valuation. For example, if a company's PE ratio is currently high but has been much higher in the past, it may not be as overvalued as it appears at first glance.
Besides the above point, to interpret PE's correctly, you still need to be vigilant about improving trend in companies RoEs and RoIC. Great companies defend their margins while constantly striving to become more efficient and profitable. For such companies, current PE can justifiably be at a premium to the long-term history. And, the reverse is equally true for bad companies.
Mistake 4: Treating PE as trading indicator
Sorry, but I am not making this up. I have talked to real people who use PE as an indicator for short term trading. Those discussion are the reason I got the courage to include it in the list of mistakes.
In my opinion, if you have a investment horizon of less than 2 to 3 years, don't even think of using PE in your decision making process. It's, by definition, a fundamental indicator of valuation. Trading is more short-term oriented, where one looks for quick trades based on short-term market moves, hence the PE ratio, which is a valuation metric based on a company's earnings (remember you use EPS of last 1 year to calculate it), may not be the most relevant indicator for short term trading. Instead, as a trader you may focus on technical indicators, such as chart patterns, moving averages and volume, which can provide a more immediate indication of market sentiment and trends.
In conclusion, the P/E ratio is an important financial metric that can help investors evaluate a stock's relative value and growth prospects. However, it is important to remember that a stock's P/E ratio is influenced by a variety of factors and should not be used in isolation when making investment decisions. By understanding the underlying factors that contribute to a stock's P/E ratio, investors can use this metric effectively and make more informed investment decisions as compared to following hard and fast rules such as 'I will never buy high P/E stocks' or 'I will only buy low P/E stocks'.
I will leave you here and would encourage you to understand and practice the analysis approach suggested above. Just in case you want to broaden your understanding on other fundamental P&L items while simultaneously filtering out some interesting companies for your watch list, you can do it here on our Revenue and Profit Analysis page.
Happy Investing!